 residentialUnder Construction
Investment Picks
Best Investment Projects in EM Bypass 2026
The Park Unizen tops our investment ranking for EM Bypass with 79/100 (EM Bypass prices up 6.5% YoY; 22% below the area median ₹/sq.ft.). Rajat Southern Vista (61) and Hiland Park (59) follow. These are picks ranked on area price growth, entry price against the local median, stage and developer track record — not guaranteed returns.
- 1Investment Score 79/100EM Bypass prices up 6.5% YoY22% below the area median ₹/sq.ft.Under construction — value can build until possessionRERA registeredresidentialUnder Construction
- 2Investment Score 61/100EM Bypass prices up 6.5% YoY19% below the area median ₹/sq.ft.Ready to move — rentable immediatelyRERA registered
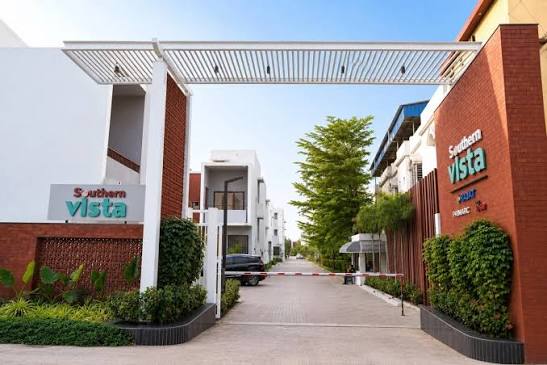 residentialReady to Move
Rajat Southern Vista
Southern Bypass / Rajpur, Kolkata RERA
3 BHK · 1,460 sq.ft.
₹1.3Croreonwards
≈ ₹8,904/sq.ft.
- 3Investment Score 59/100EM Bypass prices up 6.5% YoY36% below the area median ₹/sq.ft.Ready to move — rentable immediately
- 4Investment Score 54/100EM Bypass prices up 6.5% YoYUnder construction — value can build until possessionRERA registeredDeveloper with 24 live projects
- 5Investment Score 54/100EM Bypass prices up 6.5% YoYUnder construction — value can build until possessionRERA registeredDeveloper with 19 live projects


EM Bypass price trend
| Area | YoY growth | ₹/sq.ft. then | ₹/sq.ft. now |
|---|---|---|---|
| EM Bypass | 6.5% | ₹7,200 (2022) | ₹8,500 (2025) |
At a glance
The top 5 investment picks in EM Bypass come from 5 developers (Ambuja Neotia, Rajat Group and Hiland and 2 more) and are priced ₹85 L – ₹10.50 Cr. 4 of 5 carry a RERA number. EM Bypass shows the strongest published area growth at 6.5% a year (₹7,200 to ₹8,500 per sq.ft., 2022–2025).
How we rank
- Each project gets an Investment Score out of 100: the area's year-on-year price growth (35), entry price per sq.ft. below the area median (30, ignored when implausibly large), construction stage (15), RERA registration (10) and developer portfolio size (10).
- Area growth comes from the price trend published on each area page. It describes past movement — it is not a forecast.
Property prices can go down as well as up. Growth figures are past trends for an area, not a promise for any project; rental yield and resale value depend on the building, the market and timing. Treat this as a shortlist to research, and verify RERA details and the price on site before you invest.
Which is the best project to invest in in EM Bypass?
The Park Unizen ranks first with 79/100, by Ambuja Neotia, starting at ₹3.58 Cr.
How are these investment picks ranked?
Each project gets an Investment Score out of 100: the area's year-on-year price growth (35), entry price per sq.ft. below the area median (30, ignored when implausibly large), construction stage (15), RERA registration (10) and developer portfolio size (10).
Are returns guaranteed?
No. Growth figures describe how prices in an area moved in the past; future returns depend on the market, the building and when you buy and sell.